TL;DR: Maybe? It’s an efficient play overall (1.20 PPP) but depends on how good a player is throwing good intentional misses. It’s a higher-variance play, with a higher expected value probably only for the worst FT shooters.
Background
Intentionally missing a FT is a common enough play at the end of games, when the shooting team is down two or three points and there isn’t enough time left on the clock to keep trading free throws. There have been a couple of notable examples through the middle of this (2022-23) season: both Donovan Mitchell and Luka Dončić used this technique to tie up games very late in the fourth quarter, and both went on to win1. But should this be a more common play? Could some of the NBA’s worst free throw shooters benefit from leaving the bricks behind, and instead start tossing boomerangs?
For bad FT shooters, instead of trying to get the ball through the hoop (hard), we’re suggesting throwing the ball off the front of the rim (easier?) to get the rebound and end up in the middle of the lane with the ball and a confused defense. It also doesn’t hurt that the bottom of the NBA’s career and season FT% lists is populated by centers, who have the extra height and catch radius that may improve their odds.
The key questions are:
- How efficient can we expect this play to be?
- How good could a player be at executing the self-rebound?
Recent Examples
So far this season (as of Feb 1st), there have been 76 possessions where the FT shooter missed their last FT, but got their own rebound to extend the possession. Below are about a dozen good examples from the current season, compiled into a video. These examples (largely) show situations where the rebound goes directly back to the shooter, who then puts up another quick shot.
These are from the Advanced Stats Video notebook I put together to download the videos of specified plays from NBA Advanced Stats. You can filter the NBA play-by-play data for a particular scenario (e.g. missed last FTs followed by a rebound by the same player) and end up with a set of videos, one for each play.
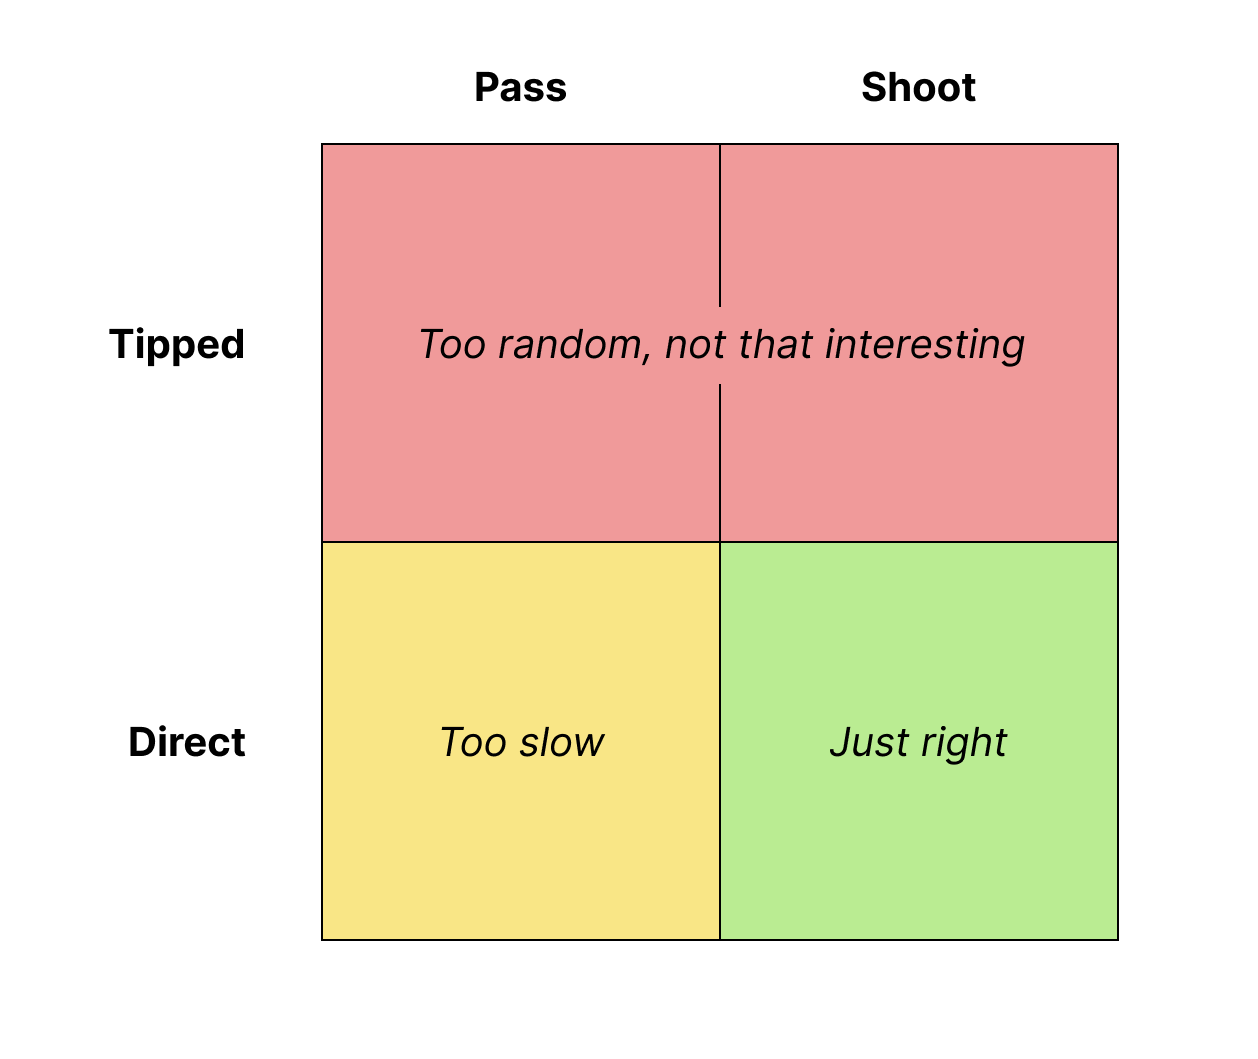
Anyway, these plays typically fall into 4 categories, depending on whether the shooter gets the rebound directly or via a tip, and whether the shooter passes or shoots the ball after getting the rebound. For this analysis, we want to focus on direct rebounds (see the diagram below). The trouble, as you’ll see below, is that separating out tipped rebounds from direct is difficult to do programatically. Passing and shooting after the rebound are both interesting, but I think the purest sense of the play is a direct rebound and immediate shot, so we’ll dive more deeply into those.
Method
Broadly, we’re going to generate a list of every single play that took place in a single NBA season, separating them out into possessions. Based on the play-by-play metadata, we can then filter down those possessions to find the ones that fit our scenario of interest.
NBA API
We can use the nba_api Python package to get the play-by-play data. Specifically, we’re using the package’s leaguegamefinder and the playbyplayv2 endpoints. The first will give us a list of game IDs for each team’s games, and the second will give us the full game play-by-play for each game ID. If we do this for each game in a season, we can get a full list of every play in an NBA season.
The key columns in the play-by-play data for this analysis are:
EVENTMSGTYPE: Play type (e.g. made shot, free throw, rebound)EVENTMSGACTIONTYPE: Sub-play type (e.g. 2nd of 2 FTs, running layup)PLAYER1_ID: Primary player IDPCTIMESTRING: Game clock timeSCORE: Current score
I’ve downloaded and saved the play-by-play data for the last 5 seasons, with some additional columns added (including whether the possession ended on a particular play and which team was in possession at the team). I’ve saved a jupyter notebook that you can use to access or download the data––each season’s .csv can be up to 250MB otherwise I’d put them straight on GitHub.
Measuring possessions
We need to measure possessions to measure efficiency, calculating the points per possession (PPP2).
I won’t go into too much detail about how the possessions are measured, but basically the diagram below shows that there are only four ways for a possession to end3. Each of these possession-ending scenarios can be mapped to the EVENTMSGTYPE and EVENTMSGACTION attributes of each pair of plays to find each instance of possession ending. We use pairs of plays because scenarios sometimes occur over two plays, e.g. a missed shot followed by a rebound, or a made shot followed by an opposition foul. With this info we can create a new column in our data that shows this as a true / false attribute for each play in our data set, and also keep track of which team is currently in possession.
There’s a full walkthrough and code example in the PBP Possessions notebook on Github.
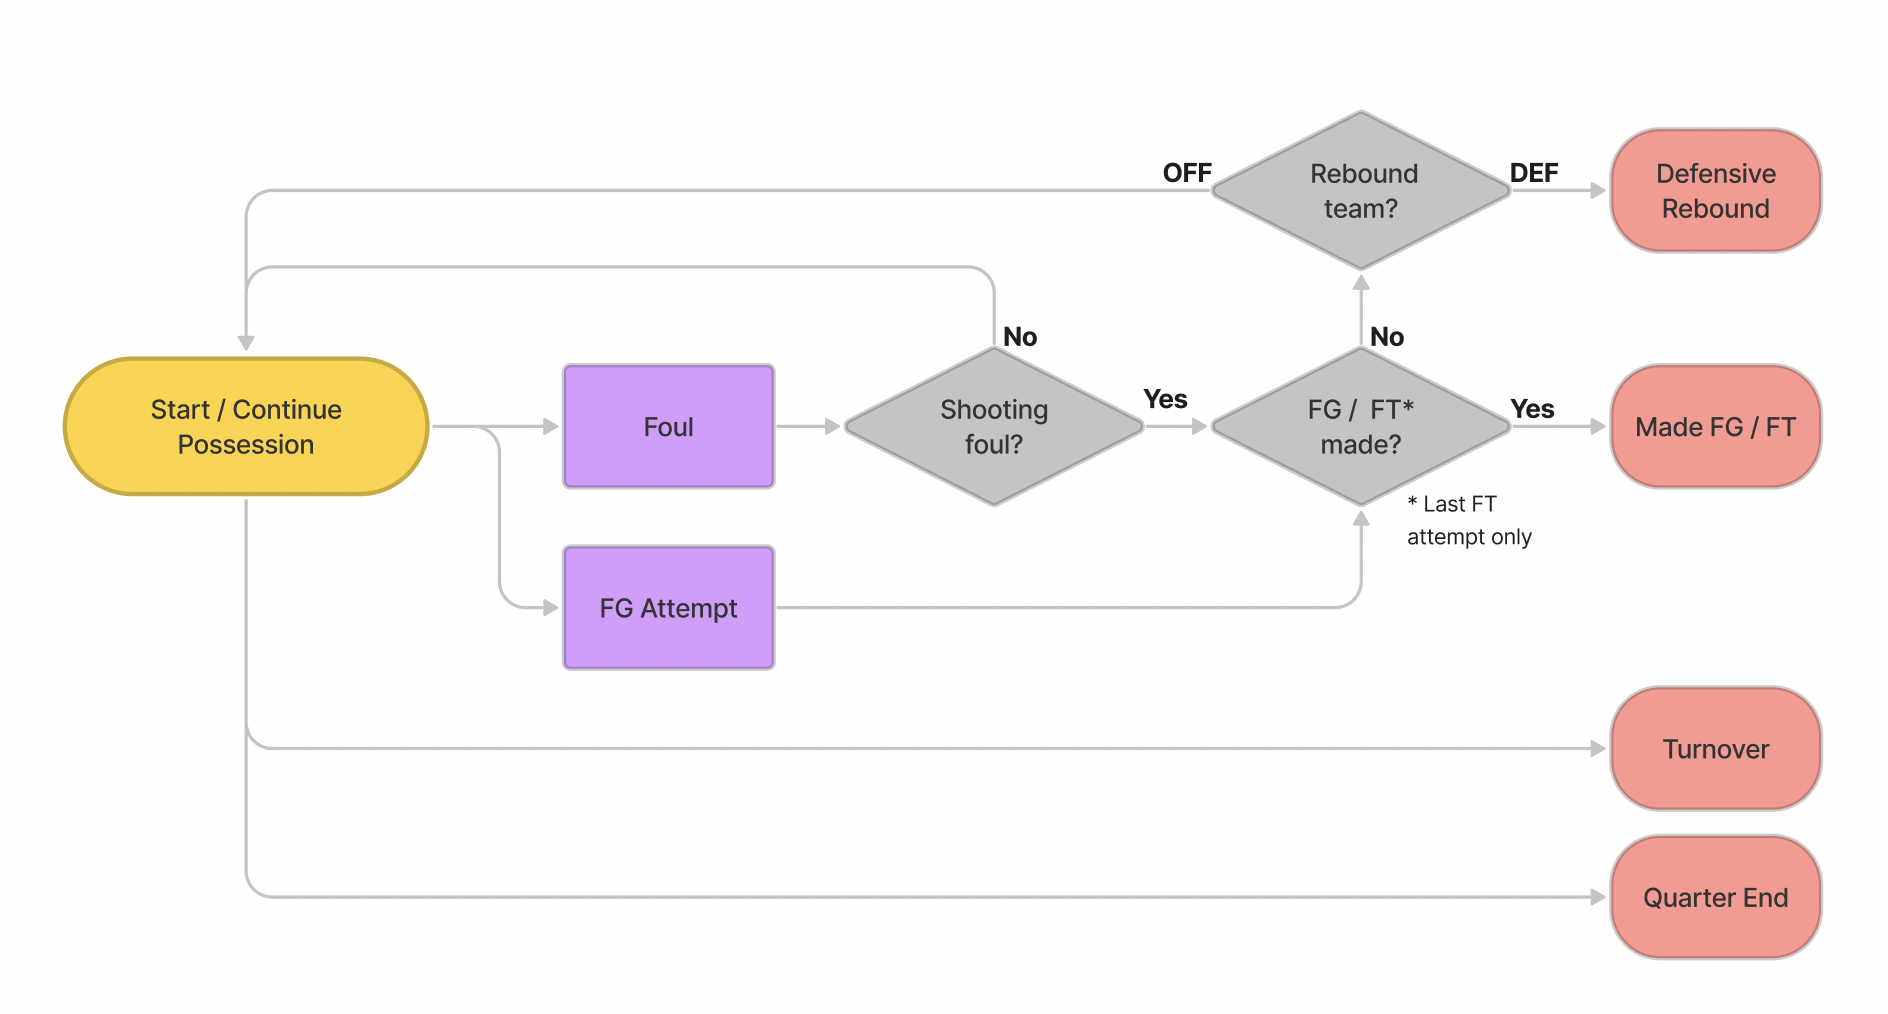
How many ways can a possession end? Note that a shooting foul includes when a team is in the bonus.
Possession efficiency
For this analysis we’re going to be measuring possession efficiency using points per possession (PPP). In this case it’s easy to measure with the play-by-play data: we take the scores at the end of the possession and subtract the scores at the start.
The only wrinkle is that NBA play-by-play data provides the score as a string for both teams, e.g. "123-120". So we split the string into two integers and do the before and after subtraction for both teams. Only one team should have a difference in score (which is our points per that possession); if both teams’ scores change, we’ve made a mistake in counting possessions. This happened to me a lot. It seems to be fixed now in PBP Possessions, so on we go.
Free throw offensive rebounds
Beyond marking up possessions, we’re also on the lookout for specific possessions where a very particular event occurs: a missed FT is rebounded by the shooter. What that looks like in terms of the data is: a last free throw (EVENTMSGACTIONTYPE = 10, 12 or 154), followed by a rebound (EVENTMSGTYPE = 4), both with the same PLAYER1_ID.
There are two main situations once the rebound is secured:
- The ball is pulled back out for another full (14 second) possession; or
- The FT shooter immediately puts the shot up.
To isolate the second situation, we can include a check for a subsequent shot (EVENTMSGTYPE = 1 or 2) with the same PLAYER1_ID and with a difference in PCTIME of less than 5 seconds.
Results
Over the last 5 years, there have been 150 possessions where a player collects their own rebound and immediately shoots. Those plays have scored 1.20 PPP. The year-by-year efficiency obviously fluctuates as each year is a fairly small sample size, but it ranges between 1.05 and 1.24 PPP.
Efficiency
NBA league average FT shooting is 78%, meaning the efficiency of a league average single free throw is 0.78 PPP. At first glance the self-rebound strategy seems to be more promising, especially for players shooting a below average FT%. But it’s important to note that the sample we got our 1.20 PPP from contains largely unintentional, all successful self-rebounds. If we included the other possible outcomes (intentional misses, unsuccessful rebounds), I’m sure the efficiency would go way down.
But this leads us to our next two questions:
- What is a reasonable expected rate of success for these plays?
- How much does purposely trying to miss improve the efficiency of these plays?
These two questions are difficult to answer using the methodology above, mostly because the characteristics that identify them aren’t captured in the play-by-play data. Some discussion is below.
Comparing the efficiency of normal free throws and these intentionally missed free throws, we get a minimum success rate of 65% (0.78 / 1.20), which doesn’t feel that high. If an average free throw shooter can execute this play more than 65% of the time, and we assume that intentional plays are as efficient as unintentional ones, than it can be a more efficient play than a normal free throw. For a below average shooter (career FT% < 60%), this success rate goes down to only 50%, which might be achievable. Noting that assumption about intentional / unintentional misses, I think that efficiency would go up with intention.
It’s difficult––probably harder than just going for the make––to intentionally miss a free throw in a way that it comes right back to you. You’re aiming for a much smaller sweet spot than a normal shot, off the front edge of the rim (or, I guess, off the backboard and then grazing off the rim). You have to stay switched on to get the rebound. As Reggie Miller says: “shoot regular because you’re gonna miss it anyway!” I (and Reggie) would expect a pretty strong correlation between a player’s free-throw percentage and their ability to intentionally miss free throws well.
The plays we’ve looked at here are also a case study in how not to box out the free throw shooter. Taller players shooting free throws are typically going to be boxed out by a shorter wing (often the 3rd tallest player on the opposing team). With a hard box out, these plays become much harder. At the end of games players box out much more aggressively––it may be a better option at the start of games, when the opposition isn’t expecting it and aren’t trying as hard to regain the possession. If a player becomes known as someone who’s doing this every time they have a live FT, then their efficiency on this play will tank as teams clue in and box them out harder to specifically limit the shooter getting his own rebound.
Just Direct Rebounds
More than half of these plays we’ve found are non-intentional, and are often tipped rebounds. Very few of them go directly back to the shooter. We can’t separate the direct rebound plays from the others using the play-by-play data––the scorekeepers are busy enough without tracking every player’s hands that touch the ball on the way to a rebound––so it’s a more manual job of individually watching and tagging each play.
For example, if we just look at the 107 plays from 2021-225, only 41 of them are direct-to-shooter rebounds, and in only 25 does the FT shooter immediately put a shot back up. We’re down to less than a quarter of the plays we started with. These plays (rebound direct to shooter, who then puts the shot back up themselves) score at 1.12 PPP, only marginally higher than the 1.10 PPP of the 107 plays overall, but at this point our tiny sample can’t really be relied on. To get a sense of the effect of having such a small sample size, if you add back in the other 16 direct-to-shooter plays (those that get passed back out), we now get an efficiency of only 0.85 PPP.
Conclusions
Overall, it’s an interesting option, increasing the variance of a play that would normally be more straightforward, with a couple of open questions:
- How can we measure the rate of success for these plays?
- Can we (automatically) isolate the intentional plays from the unintentional ones?
There are also plenty of other methods to try first to improve your FT%, before give up trying to make them entirely:
- Shooting underhanded (the Granny shot)
- Shooting one-handed (e.g. Jeremy Sochan)
- Warming up by miming your entire routine without the ball (e.g. Giannis)
-
Luka Doncic (NYK @ DAL - 2022-12-28), and Donovan Mitchell (CHI @ CLE - 2023-01-03) ↩
-
Not to be confused with Public-Private Partnerships. ↩
-
Not shown in the diagram is the situation caused by technical free throws, where a team can make a FT but still maintain possession. This doesn’t increase the number of ways a possession can end, though. ↩
-
1 of 1, 2 of 2, and 3 of 3, respectively. ↩
-
Just because it’s the last full season, not because it substantially changes the results compared to the current 2022-23 season. ↩